About Us

Our Businesses

Investors
Responsibility
Media
Careers
About Us
Our Businesses
Investors
Responsibility
Media
Careers
As at 13th September 2025
Group revenue
Adjusted operating profit*
Gross investment*
Basic earnings per share
Operating profit
Profit before tax
Adjusted profit before tax*
Adjusted earnings per share*
Net cash before lease liabilities*
Net debt including lease liabilities*
Return on average capital employed* (‘ROACE’)
Dividends per share
*Alternative Performance Measures (APMs) as defined on pages 219 to 223 in the Annual Report.
For the 52 weeks ending 13 September 2025
We use key performance indicators (KPIs) to measure our progress in delivering the successful implementation of our strategy and to monitor our performance.
| '21 | '22 | '23 | '24 | '25 | |
|---|---|---|---|---|---|
| Revenue | 13.9 | 17.0 | 19.8 | 20.1 | 19.5 |
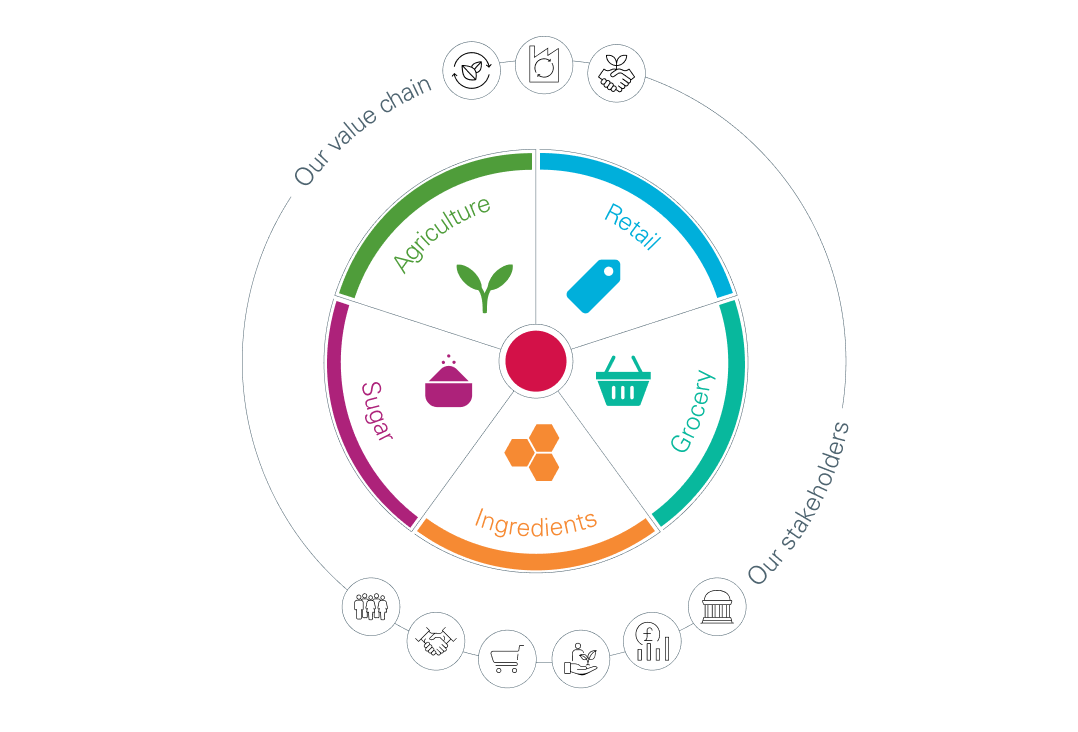
Revenue is a measure of business growth. Constant currency comparisons are also used to provide greater clarity of performance.
| '21 | '22 | '23 | '24 | '25 | |
|---|---|---|---|---|---|
| Adjusted Operating Profit | 1011 | 1435 | 1513 | 1998 | 1734 |
Adjusted profit and earnings measures provide a consistent indicator of performance year-on-year and are aligned with management incentive targets.
| '21 | '22 | '23 | '24 | '25 | |
|---|---|---|---|---|---|
| Adjusted Earnings per share | 80.1 | 131.1 | 141.8 | 196.9 | 174.9 |
The Group’s organic growth objective aims to deliver steady growth in earnings over the long term.
| '21 | '22 | '23 | '24 | '25 | |
|---|---|---|---|---|---|
| Gross Investment | 721 | 930 | 1171 | 1281 | 1244 |
A measure of the commitment to the long-term development of the business.
| '21 | '22 | '23 | '24 | '25 | |
|---|---|---|---|---|---|
| Free cash flow | 419 | -84 | 269 | 1355 | 648 |
The free cash flow measure represents the cash that the Group generates from its operations after maintaining and investing in its capital assets.
| '21 | '22 | '23 | '24 | '25 | |
|---|---|---|---|---|---|
| Net cash before lease liabilities | 1901 | 1488 | 895 | 1044 | 390 |
This measure monitors the Group’s liquidity and capital structure and is used to calculate the Group’s liquidity ratio.
| '21 | '22 | '23 | '24 | '25 | |
|---|---|---|---|---|---|
| Return on average capital employed | 9.8 | 14.0 | 13.6 | 18.1 | 15.5 |
This measure monitors the level of return generated by the Group’s investment in its operating assets. It is also a key part of management incentive targets.
| '21 | '22 | '23 | '24 | '25 | |
|---|---|---|---|---|---|
| Financial leverage | 0.7 | 0.8 | 1.0 | 0.7 | 1.0 |
This measure monitors the Group’s financial strength to ensure long-term financial stability.
| '21 | '22 | '23 | '24 | '25 | |
|---|---|---|---|---|---|
| Dividends per share - interim and final | 26.7 | 43.7 | 47.3 | 63.0 | 63.0 |
| Dividend per share - special | 13.8 | 0.0 | 12.7 | 27.0 | 0.0 |
The Group’s organic growth objective aims to deliver steady growth in dividends over the long term. This included the payment of special dividends of 13.8p, 12.7p and 27.0p in 2021, 2023 and 2024 respectively.
*APMs as defined on pages 219 to 223 in the Annual Report.
Each business develops KPIs relevant to its operations. These are monitored regularly. In the case of adjusted operating profit and return on average capital employed, we use them as metrics to incentivise our management teams.
We use key performance indicators (KPIs) to measure our progress in delivering the successful implementation of our strategy and to monitor our performance.
| '21 | '22 | '23 | '24 | '25 | |
|---|---|---|---|---|---|
| Lost time injuries | 346 | 352 | 347 | 392 | 425Δ |
| Lost time injury rate | 0.39% | 0.36% | 0.35% | 0.39% | 0.41Δ% |
A measure of the Group’s management of the health and safety of its employees – the number of on-site lost time injuries resulting from an accident arising out of, or in connection with, on-site work activities and the proportion of the full-time equivalent workforce experiencing a lost time injury.
| '21 | '22 | '23 | '24 | '25 | |
|---|---|---|---|---|---|
| Number of employees (rounded) | 127912 | 132273 | 133487 | 138271 | 138155Δ |
| Number of Countries | 53% | 53% | 53% | 55% | 56% |
Measure of the scale and diversity of our operations. Reflecting all employees in the Group with a contract of employment, whether full-time, part-time, contractor or seasonal worker and highlighting the number of countries of operation.
| '21 | '22 | '23 | '24 | '25 | |
|---|---|---|---|---|---|
| Percentage of women in workforce | 53% | 54% | 55% | 57% | 57%Δ |
The proportion of our employees that have disclosed their gender as female/woman in line with the local legislation.
| '21 | '22 | '23 | '24 | '25 | |
|---|---|---|---|---|---|
| (000 tonnes CO2 e) | 2779 | 2785 | 2587 | 2627 | 2410Δ |
The amount of ABF Group Scope 1 and 2 (market-based) greenhouse gas emissions.
| '21 | '22 | '23 | '24 | '25 | |
|---|---|---|---|---|---|
| (000 tonnes CO2 e) | 4763 | 6584 | 7116 | 6288 | 6040Δ |
The amount of Primark’s Scope 1, 2 (market-based) and 3 greenhouse gas emissions.
| '21 | '22 | '23 | '24 | '25 | |
|---|---|---|---|---|---|
| Total energy consumed | 20808 | 20140 | 20548 | 20697 | 18459Δ |
| Proportion from a renewable source | 57% | 56% | 59% | 57% | 54Δ% |
Total energy used and the proportion of which is from renewable sources. Renewable energy is mainly generated on our sites from biogenic sources.
| '21 | '22 | '23 | '24 | '25 | |
|---|---|---|---|---|---|
| Primark selling space | 16842 | 17302 | 18198 | 18759 | 19510Δ |
| Number of countries of operation | 14 | 14 | 16 | 17 | 17Δ |
These two measures represent the retail space growth and breadth of Primark’s presence.
| 2021 | 2022 | 2023 | 2024 | 2025 | |
|---|---|---|---|---|---|
| Waste Generated | 424 | 458 | 374 | 499 | 510Δ |
| Waste recycled | 88% | 93% | 92% | 94% | 94Δ% |
A measure of the total waste generated in our own operations and the proportion of waste sent for recycling or other beneficial use instead of being sent to landfill for disposal.
| '21 | '22 | '23 | '24 | '25 | |
|---|---|---|---|---|---|
| (million m3) | 858 | 791 | 859 | 880 | 808Δ |
This measure includes water supplied by third parties or from local water resources.
The Group data in this report on our environmental and safety KPIs covered the period 1 August to 31 July, excluding Primark selling space and number of countries of operation and employee numbers.
Δ EY has provided limited independent assurance over the 2025 metrics. See page 152 of the Annual Report 2025 for EY’s assurance statement.
* Prior year numbers have been restated to reflect the disposal of AB Sugar China, disposed of in 2024. The adjustment ensures comparability and accuracy in reporting the Group's continuing operations.