About Us

Our Businesses

Investors
Responsibility
Media
Careers
About Us
Our Businesses
Investors
Responsibility
Media
Careers
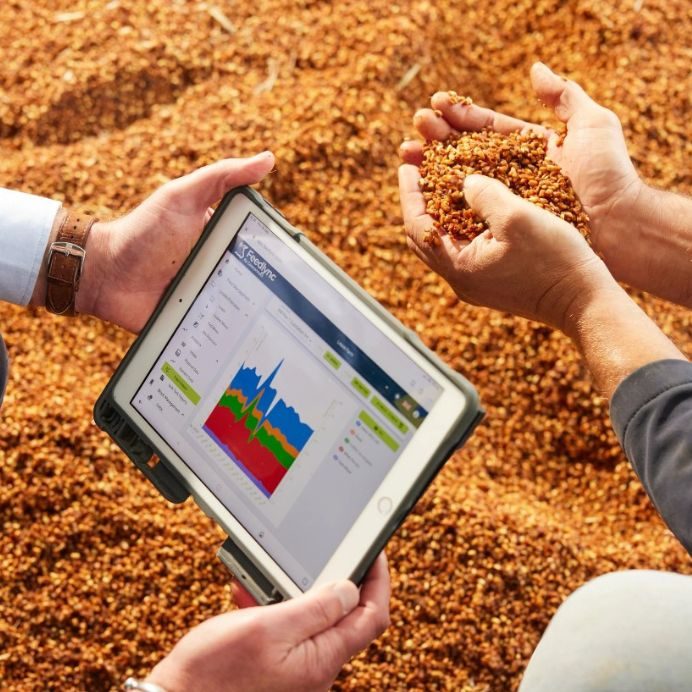
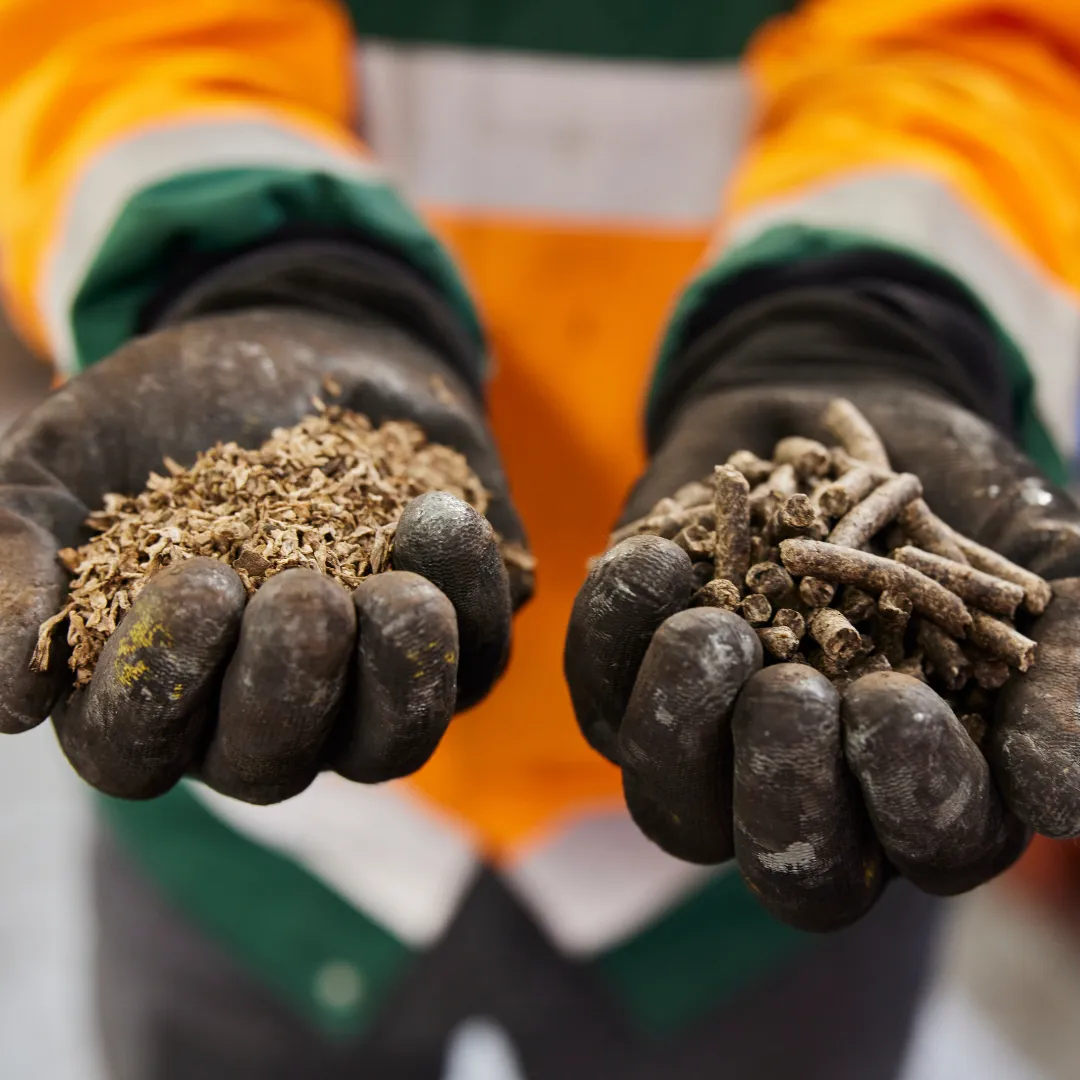 Pressed sugar beet pulp, which is a by-product from sugar production, and dried animal feed, which British Sugar manufactures from the pulp, Wissington, UK
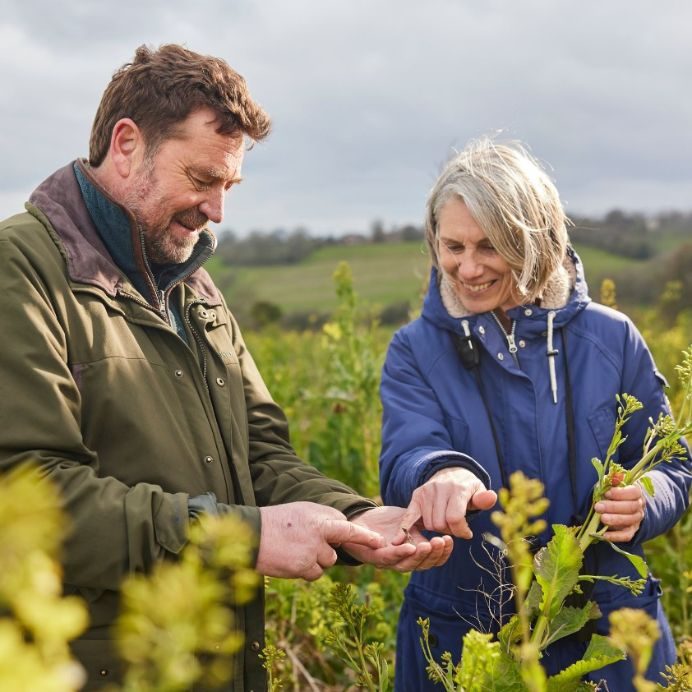
We believe that waste materials are simply products for which we have not yet found a use. With that in mind, our businesses are implementing practices to reuse, recycle or reduce all sources of waste, including food, feed, plastic and textile.
Our businesses produce many commercially viable products from sources potentially considered waste. For example, several of our businesses have become major suppliers of raw materials for animal feed, an important feedstock source for many different sectors, and are suppliers of raffinate and betaine for use in the petrochemical and pharmaceutical sectors. Additionally, several of our businesses divert low-value waste from landfill for use as a soil improver. For example, filter cake residue is used as a soil improver in the sugar cane fields at Nakambala, Zambia.
Our food and ingredients businesses aim to avoid products going to waste by donating surpluses to food banks, community groups and charities. Where applicable, food waste is used as animal feed or in energy generation.
Across the Group, we generated 510kt of waste in 2025 which is a 2% increase compared with the 499kt tonnes generated in 2024. The majority of this waste was recycled or reused, with the increase mainly linked to temporary operational inefficiencies in AB Agri, which have now been addressed.
Of the total waste generated by the Group, 94% was recycled or repurposed for other beneficial uses. Within our sugar businesses, 98% of total waste is recycled or sent for other beneficial use. Across our businesses, 53 sites sent no waste to landfill and an additional 21 sites recycled or sent for reuse more than 95% of their waste. See our data page for more details on our waste data.
Some businesses use on-site anaerobic digesters to generate biogas from waste water. Several sites generate and use biogas as a renewable fuel source. Our sugar businesses in Africa use bagasse, the dry fibrous material that remains after crushing sugar cane, as a feedstock to meet up to 83% of their annual power requirements.
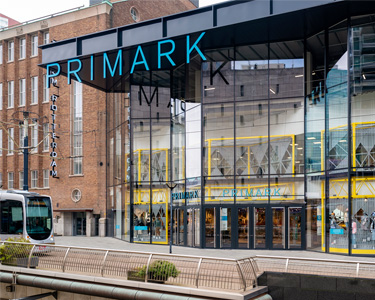
Primark has worked with the Ellen MacArthur Foundation since 2018 and sits on its Advisory Board for Fashion. In 2024, Primark joined the Foundation’s The Fashion ReModel to help the industry unlock the barriers to scaling circular business models.
| 2021 | 2022 | 2023 | 2024 | 2025 | |
|---|---|---|---|---|---|
| Waste Generated | 424 | 458 | 374 | 499 | 510 |
| Waste recycled | 88% | 93% | 92% | 94% | 94% |
| Retail | Grocery | Ingredients | Sugar | Agriculture | |
|---|---|---|---|---|---|
| 000 tonnes | 91 | 91 | 41 | 279 | 8 |
As a leading provider of food, ingredients and clothing, packaging contributes significantly to our groupwide environmental footprint. Paper is the main packaging material used across the Group, followed by plastic and glass. Our businesses also use wood, steel, aluminium and a number of other materials.
Though we fully recognise the harmful effects of plastic waste on ecosystems, plastic currently plays a vital role in both ensuring the safety and quality of products and reducing food waste by extending the shelf life of food. The challenge for our businesses is to find solutions that balance the needs of our customers and our focus on reducing the impact of plastics on ecosystems. Where viable, our businesses are doing this by removing unnecessary packaging, switching to more easily recyclable types of plastic and increasing the use of recycled content in the plastics we use.
Our businesses also demonstrate their commitment to tackling plastic and packaging challenges by being involved with and supporting a number of collaborative industry pacts and programmes, including the WRAP UK Plastics Pact and the Soft Plastic Recycling Scheme in New Zealand.
In 2025, our businesses used 250kt of packaging compared with 241kt used in 2024, representing a 4% increase, primarily driven by higher usage in our sugar businesses to meet customer demands, including a shift from bulk formats to smaller pack sizes.
In the UK, our businesses have been investing in the collection, verification and reporting of additional packaging data to facilitate compliance with the requirements of the Recyclability Assessment Methodology under the UK’s Extended Producer Responsibility for Packaging regulations.
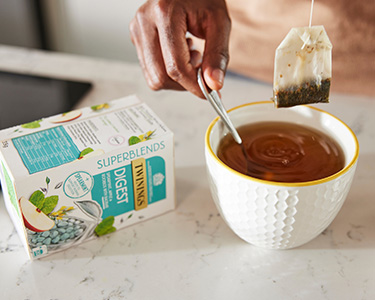
Our food businesses are striving to reduce packaging, improve recyclability and replace plastic with alternative materials such as cardboard. For example, in calendar year 2024, 88% of Grocery Group’s packaging materials were either fully recyclable in the UK or recyclable where recycling facilities exist. Twinings has removed plastic wrap from around 75% of its cartons and ensured all tea bags produced at its main manufacturing sites in Andover, UK and Swarzędz, Poland are made with plant-based, industrially compostable tea paper. Tip Top has also moved to 100% recycled cardboard cartons across all retail and food service products, eliminating around 500 tonnes of virgin cardboard each year. As one of its main sources of non-clothing waste, product packaging is a priority focus area for Primark and the business has established a dedicated packaging team to drive innovation. See our data page for more details on plastic and packaging.
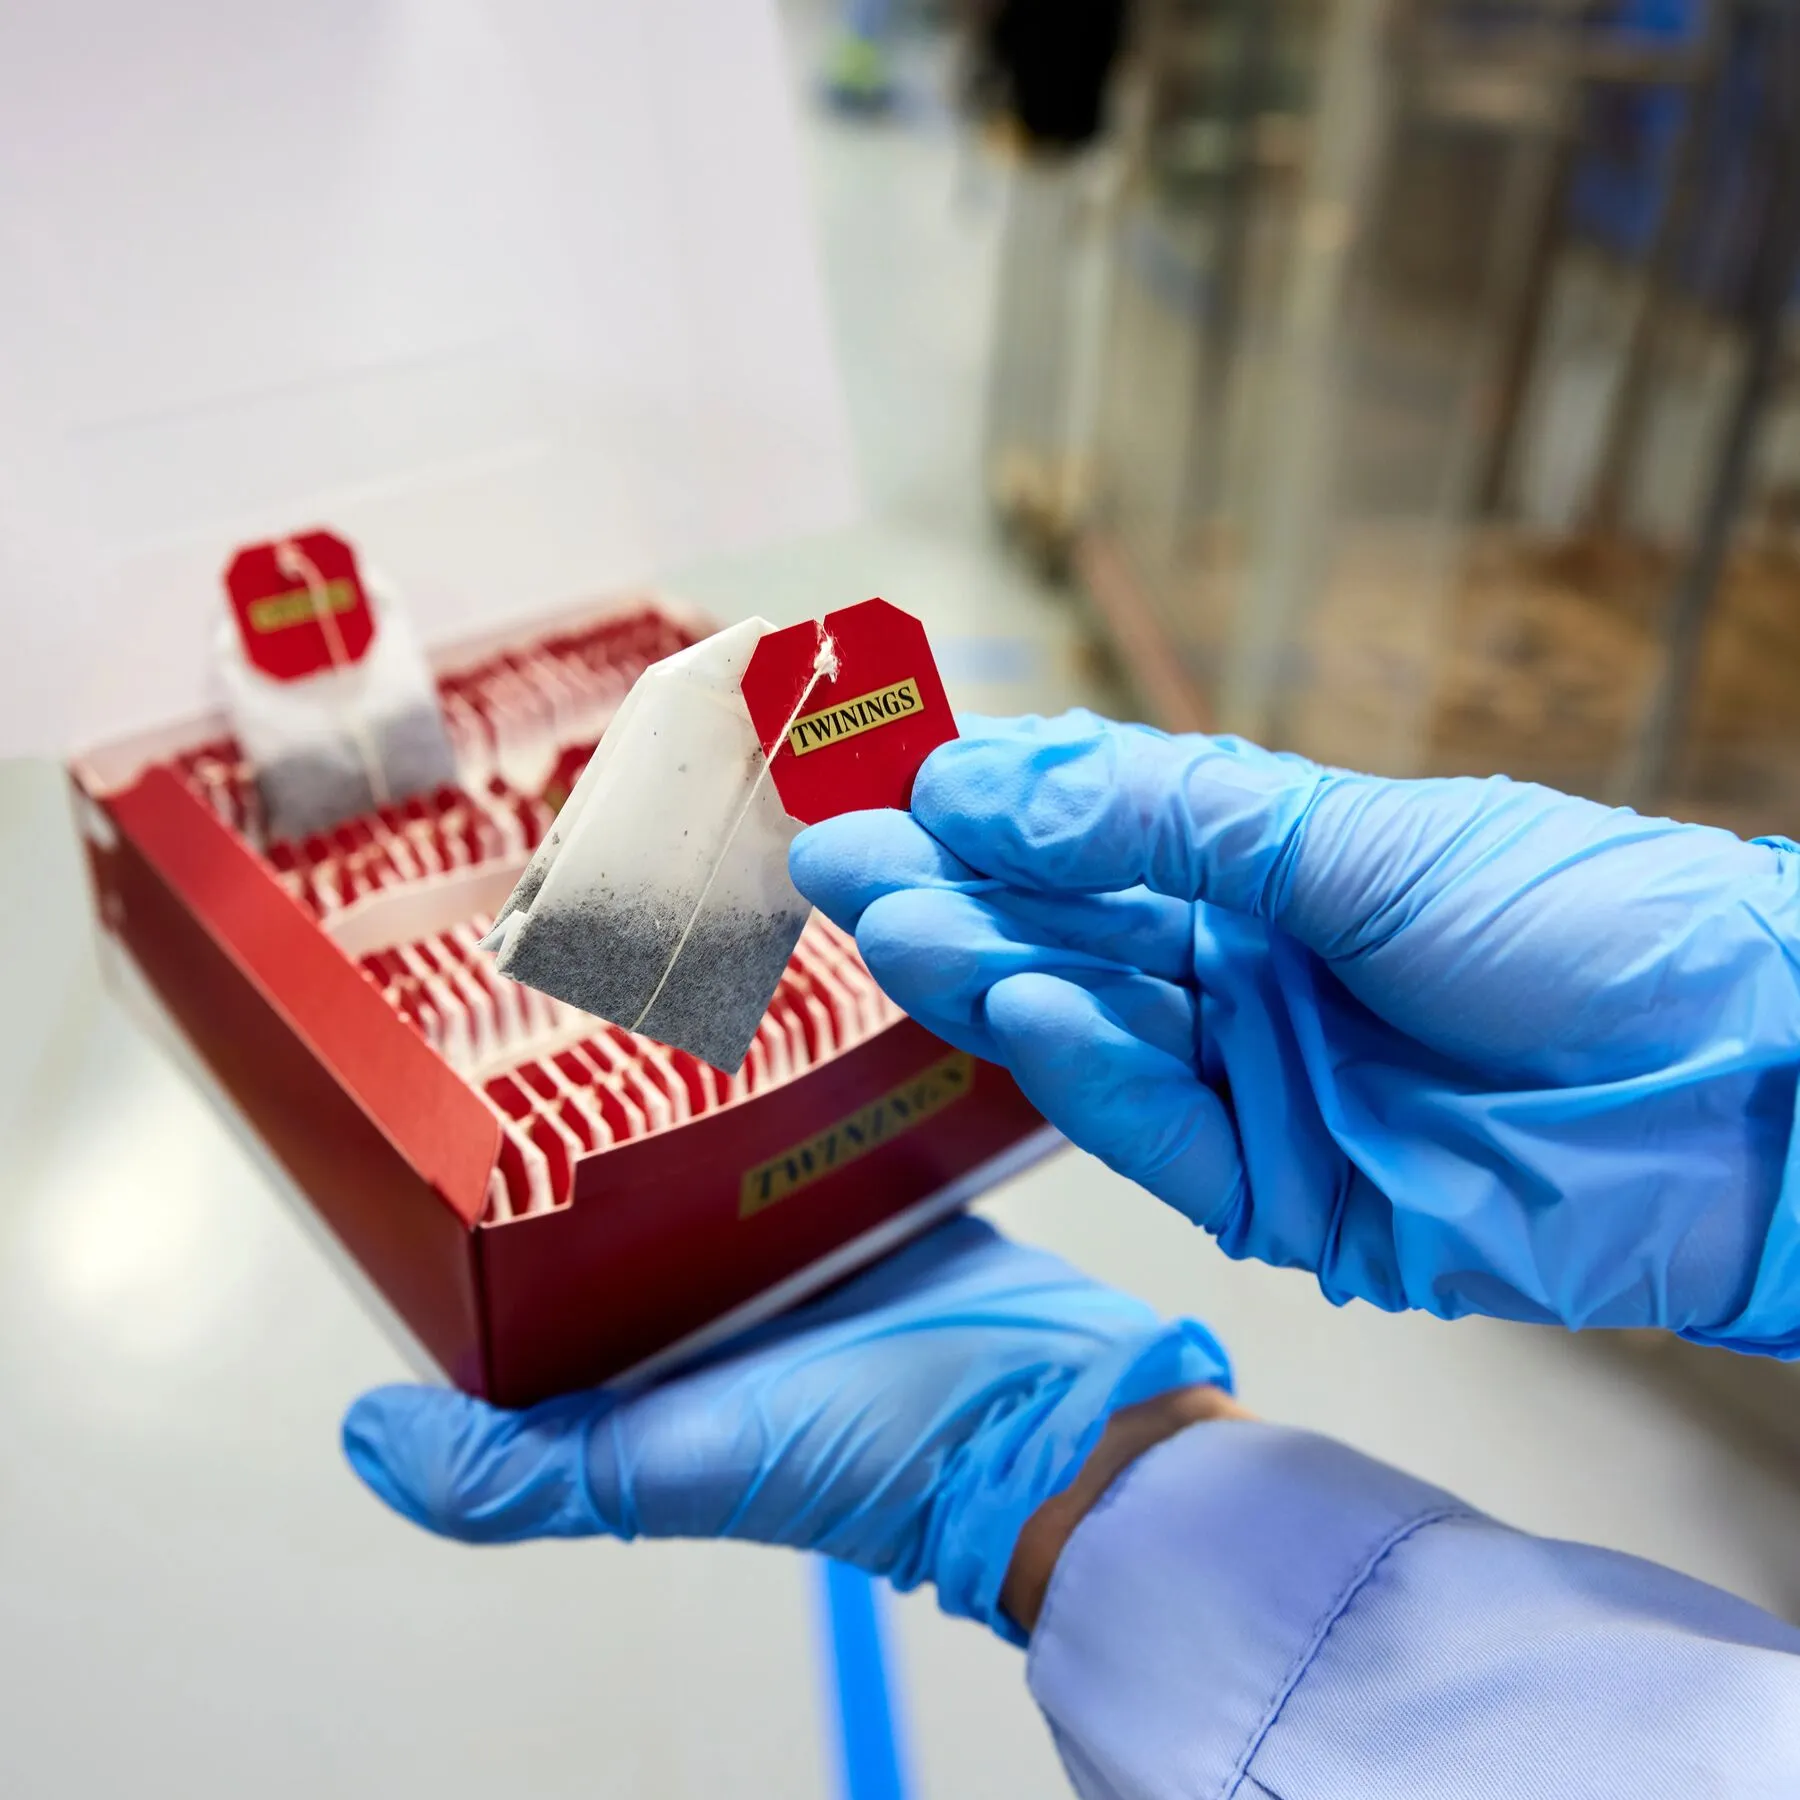 English Breakfast teabags produced at the Twinings manufacturing facility in Swarzędz, Poland
| 2021 | 2022 | 2023 | 2024 | 2025 | |
|---|---|---|---|---|---|
| ABF | 229 | 264 | 246 | 241 | 250 |
* Numbers prior to 2025 have been restated to reflect the disposal of AB Sugar China, disposed of in 2024. The adjustment ensures comparability and accuracy in reporting the groups continuing operations